In this episode of the GrowthTLDR, we talk about all things distribution tams (total addressable markets). We discuss how the path to growth for most B2B companies looks the same and how we spend most of our time trying to grow from a couple of marketing channels incrementally.
But, we don't spend very much time figuring out how much growth is available on these marketing channels.
We discuss if it's possible to build a total addressable market for the channels you want to grow from incrementally.
 iTunes
 Stitcher
 Spotify
Something I've become increasingly fascinated by is how near all B2B marketing strategies evolve in the same way.
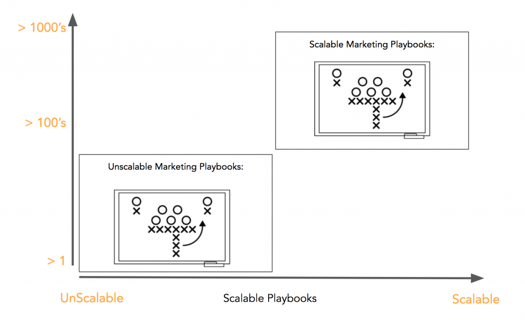
Your marketing strategies begin with doing unscalable things when you pre-product market fit, and a growing startup. Here is an excellent post from Lenny Rachitsky on how famous brands used unscalable tactics to get some initial traction.
When you transition from startup to scaleup, you look for scalable ways to grow your business. There aren't many channels that can give you scalable growth. Here is a simple graphic that talks to this.
Another way to picture how B2B brands grow in similar ways is by condensing most strategies into these four quadrants.
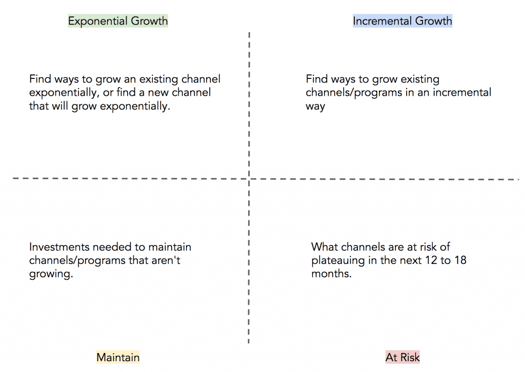
When companies hit that scaleup phase, they've figured out a couple of things that work. They then settle into incrementally improving those things and maintaining most other things.
The exponential growth quadrant is primarily a B2C quadrant because distribution is 'do or die' in the B2C industry. That's why you see companies like Uber trying to do a deal for Grubhub so they can exponentially grow their distribution engine in that space.
The at-risk quadrant is the channels you feel will plateau in growth over the next 12 to 18 months.
Within the incremental quadrant, you know where the growth is coming from, what you spend most time and effort on is figuring out how you'll grow, and how much growth is left.
We spend 99% of our time talking about how we'll grow, with tactics, hacks, experiments.
We could do a better job of figuring out how much growth is left, thinking about the different distribution TAMs we have in both the incremental and exponential quadrant.
Let's do a fun thought exercise of how we might do that by starting with organic search.
It has become commonplace for SEO strategies to be developed around the topic & cluster model. You build out content around topics and clusters vs. keywords.
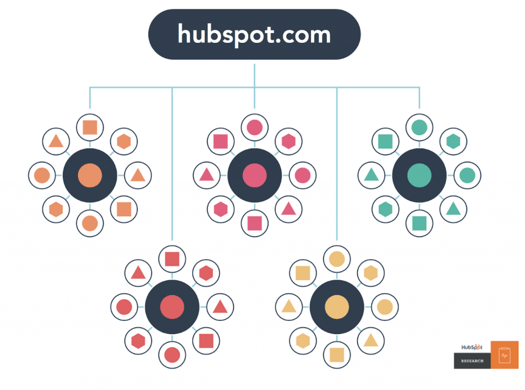
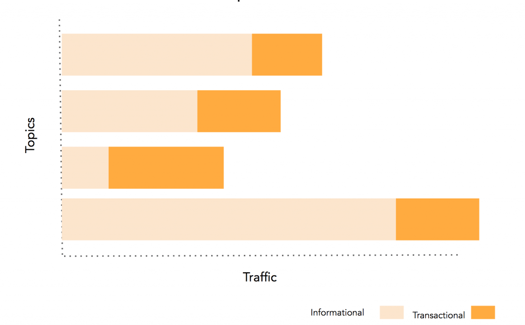
We can conceivably build a TAM for each of those topics by summing up all of the monthly search traffic associated with those topics. I like to think about visualizing those TAMs split out by informational and transactional traffic.
Informational: The content you publish to help educate people on both the problems they have and potential solutions.
Transactional: The content you publish to help convince people you're the best solution for them.
Even if all you take away from this thought exercise is building out topic tams and stack ranking them to prioritize how you think about developing content for them, you'll be able to plan better for future growth.
But, let's riff on it some more. Let's imagine doing this for all organic search. What are some of the things we could investigate?
1. Available Traffic (Topic Tams)
We've already discussed the idea of topic tams. We can map all the topics relevant to our personas, create individual tams for them, and add them up.
2. Estimated Traffic
We can hypothesize about the traffic we expect to get from all of those topic tams combined. For example, we could create a range of outcomes:
- Lower Range: The average amount of traffic you can expect by ranking between positions 10 to 8. You can either used benchmark data or use data you have from the Google Search Console.
- Medium Range: The average amount of traffic you can expect by ranking between positions 8 to 5.
- Upper Rate: The average amount of traffic you can expect by ranking between positions 5 to 1.
You can tailor the above for your needs. You should also know it's not going to be one hundred percent accurate, but it's enough to give you something that's directionally correct.
3. Saturation
You can de-dupe the topics against keywords where you already rank in the top ten in Google. In this way, you get a true reflection of the market opportunity if you rank for new keywords or improve the rank of existing ones.
4. Expected Conversions
We can hypothesize about the expected conversions we'll get from all this traffic. We can use existing conversion rates from topics we've already built out or use an industry-standard until we have real data.
It's not a small job to do this, but it's not an unreachable task either. Doing something like this will mean you can have a more accurate picture of how big the opportunity is and how you should think about investing in it.
There are other examples of how you can apply this to other channels. For example, with paid advertising, you can model how much money you can spend before reaching a ceiling on your profitability.
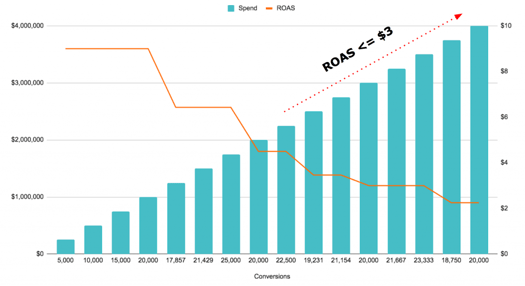
Here our threshold for a return on ad spend (ROAS) is $3. We want to make at least $3 for every $1 we spend. We know our cost to acquire leads/users increases as we spend more money. At some point, we'll dip below that budget, and it will no longer be feasible for us to grow via paid advertising unless we:
- Get better performance from our ads
- Expand our market via new products or new languages
Make sure you listen to the full episode for all of the above and some more. And be sure to connect with me on LinkedIn or Twitter if you have feedback/questions.
Topics: Podcast, Swipefile, Customer Acquisition